![]()
![]()
![]()
![]()
Paper Pencil
Overview
| Product Idea and description |
| ||||||||||||||||||||||
| Target group |
| ||||||||||||||||||||||
| Raw material required |
| ||||||||||||||||||||||
| Production capacity, facility and labor required |
| ||||||||||||||||||||||
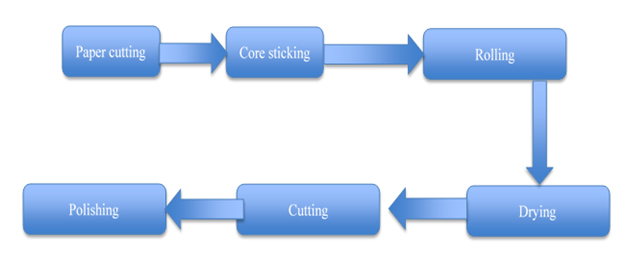
| Production Process |
| ||||||||||||||||||||||
| Tools &Equipment’s required for production and prices |
| ||||||||||||||||||||||
| Financial linkages/ Government schemes |
| ||||||||||||||||||||||
| Pricing Strategy |
| ||||||||||||||||||||||
| Package, storage and transportation requirements |
| ||||||||||||||||||||||
| Marketing strategy | India Stationery market holds tremendous growth potential as the country has nearly 22-24 crore students studying and requiring notebooks and other stationery materials. Increasing number of schools and offices, improved standard of living as well as shift in focus from inexpensive to premium quality products on account of rapidly burgeoning economy are some of the crucial factors which would drive the demand for stationery products in India over the next six years. Further, government initiatives such as National Policy on Education and Sarva Shiksha Abhiyan to ensure low cost and quality compulsory education for all would also spur the growth of stationery market in India. India stationery market revenues are projected to grow at a CAGR of 10.5% during 2018-24.
| ||||||||||||||||||||||
| Distribution Channel |
|
Production stage
Product SWOT Analysis
|
Strengths |
Weaknesses |
Opportunities |
Threats |
|
|
|
|
Financial Plan
To start the paper pencil manufacturing business, one can invest 15.58L INR with a working capital requirement of 1.57L INR per month, assuming the working capital cycle is 25 days and runs for a total of 8 work hours in a day.
Financial Summary Sheet:
| S.No | Parameters | Unit | Value |
| 1 | Capital Cost | INR | 1558860 |
| 2 | Working Capital | INR | 1893600 |
| 3 | Total Cost of Investment | INR | 3452460 |
| 4 | Sales | INR | 6000000 |
| 5 | Gross profit | INR | 2547540 |
| 6 | Tax @ 30% | INR | 764262 |
| 7 | Net Profit | INR | 1783278 |
| 8 | Pay Back Period (Total Investment/Net Profit*12) | Months | 23 |
Capital Cost:
| S.No | Parameters | Value |
| 1 | Land & Building | 800000 |
| Machinery & equipment | ||
| 2 | Rolling Machine | 130000 |
| 3 | Cutting Machine | 80000 |
| 4 | Rubbing Machine | 120000 |
| 5 | Valvet Coating Machine | 23000 |
| 6 | Oven | 93600 |
| 7 | Stamping Machine | 16000 |
| 8 | Ferrule Machine | 150000 |
| 9 | Electrification & Installation @ 10% cost of machinery | 61260 |
| 10 | Pre-Operative Expense | 50000 |
| 11 | Cost of Office Equipment | 35000 |
| 12 | Total Capital Cost | 1558860 |
Working Capital:
|
S.No |
Parameters |
INR/Unit |
Value |
|
1 |
Workers (10 No.) |
8000 |
80000 |
|
2 |
Manager (1 No.) |
15000 |
15000 |
|
Raw Material & Utilities |
|||
|
3 |
Raw Material |
25800 |
|
|
4 |
Utility per Month |
10000 |
|
| 5 | Water | 1500 | |
|
Other Contingent Expenses |
|||
| 6 | Repair & Maintenance | 1000 | |
|
7 |
Transportation |
5000 |
|
|
8 |
Telephone |
1000 |
|
|
9 |
Other Consumables |
1000 |
|
|
10 |
Advertisement & Publicity |
5000 |
|
|
11 |
Postage & Stationary |
500 |
|
|
12 |
Insurance |
10000 |
|
|
13 |
Miscellaneous Expenses |
2000 |
|
|
14 |
Grand Total of Working Capital (1 Year) |
1893600 |
|
Turnover Calculation:
S.No | Parameters | Unit | Value |
1 | Production per Month | Pieces | 20000 |
2 | Selling Price per Product | INR | 2.5 |
3 | Turnover per Month | INR | 500000 |
4 | Annual Turnover | INR | 6000000 |